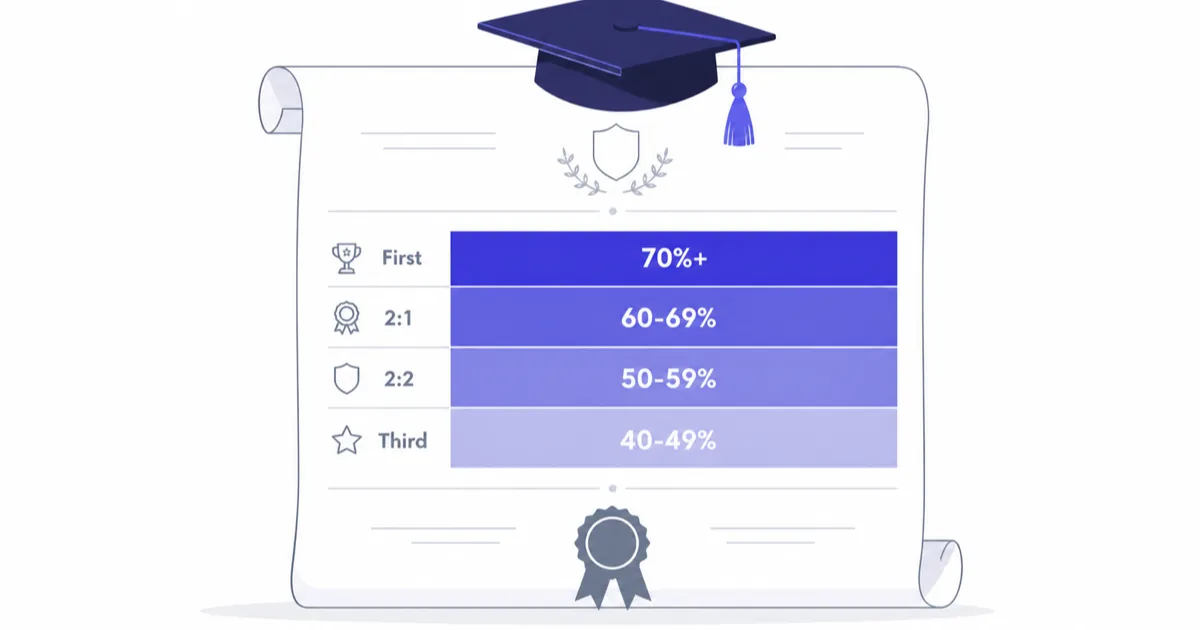
First Class Honours (1st) — 70% and Above
A First Class Honours degree, commonly called a "First," is the highest classification available to undergraduate students. It requires an overall credit-weighted average of 70% or above. A First signals exceptional academic ability, deep subject knowledge, strong analytical skills, and the capacity for independent thought.
Achieving a First requires consistent high performance across most modules. A single outstanding mark cannot compensate for mediocre grades elsewhere because the classification is based on a weighted average. Students aiming for a First typically need to demonstrate excellence in both coursework and examinations, showing critical thinking beyond simple knowledge reproduction.
In practical terms, a First opens doors to the most competitive career paths. Top-tier graduate schemes in investment banking, management consulting, corporate law, and the civil service fast stream typically require a First or a high 2:1. For students considering academia, a First is usually the minimum expectation for PhD programme entry and research funding applications.
In 2022/23, HESA reported that 30% of classified first-degree qualifiers achieved a First. HESA excludes unclassified first degrees from this breakdown.
Upper Second Class Honours (2:1) — 60% to 69%
The Upper Second Class degree, universally known as a "2:1" (pronounced "two-one"), requires an average between 60% and 69%. It is the most commonly awarded UK degree classification: HESA recorded 48% of classified first-degree qualifiers at this level in 2022/23.
A 2:1 is widely regarded as the benchmark for graduate employment. The majority of competitive graduate programmes list a 2:1 as their minimum academic requirement. This includes roles in finance, law, engineering, consulting, the NHS graduate management training scheme, and the civil service. Many postgraduate taught programmes (Masters degrees) also require a 2:1 for entry.
The 2:1 band spans ten percentage points, which means there is a meaningful difference between a student averaging 61% and one averaging 69%. Some employers and postgraduate programmes differentiate within the 2:1 band, looking at the precise average or the proportion of modules in the First class range. If you are close to the 70% boundary, check whether your university has a borderline policy that could upgrade you to a First.
Lower Second Class Honours (2:2) — 50% to 59%
A Lower Second Class degree, known as a "2:2" (pronounced "two-two"), requires an average between 50% and 59%. HESA recorded 20% of classified first-degree qualifiers at this level in 2022/23.
While a 2:2 may exclude you from some highly competitive graduate schemes that specify a 2:1 minimum, it remains a solid academic achievement that many employers value. Sectors such as marketing, digital media, retail management, hospitality, creative industries, and technology startups frequently hire 2:2 graduates. Small and medium-sized enterprises (SMEs) often value personality, motivation, and relevant experience above degree classification.
If you have a 2:2 and are targeting roles that typically require a 2:1, you can strengthen your application through relevant work experience, internships, professional certifications, a strong portfolio, or a postgraduate qualification. Some Masters programmes accept students with a 2:2, particularly if they have relevant professional experience.
Third Class Honours (3rd) — 40% to 49%
A Third Class Honours degree requires an average between 40% and 49%. It is the lowest Honours classification; HESA recorded 3% of classified first-degree qualifiers as third/pass in 2022/23.
A Third is still a university degree and carries value. While it may limit access to some structured graduate programmes, many career paths do not have formal academic entry requirements. Entrepreneurship, sales, property, trades, and many creative fields focus on skills and experience rather than classification. Many highly successful business leaders and public figures graduated with a Third. Students with vocational qualifications like a BTEC can use our BTEC grade calculator to check how their pre-university grades translate.
If you are currently tracking towards a Third and want to improve, our final grade calculator can help you work out exactly what marks you need on your remaining assessments to reach a higher classification.
Ordinary Degree and Fail
Students who complete degree requirements but score below 40% may be awarded an Ordinary degree (also called a pass degree) rather than an Honours degree. This means no classification suffix appears on the certificate. In Scotland, an Ordinary degree is sometimes a deliberate three-year exit qualification, distinct from the four-year Honours programme.
A Fail occurs when a student does not meet the minimum requirements for any degree award. This may happen due to not accumulating enough credits, failing compulsory modules without the option to resit, or not completing the programme.
How Degree Classifications Are Calculated
Degree classifications are based on a credit-weighted average of your module marks. The formula is:
Overall Average = Σ(Module Grade × Module Credits) ÷ Total Credits
Most universities only include marks from your second and final years in this calculation. First-year marks typically do not count towards the classification, though you must pass them to progress. The final year usually carries more weight than the second year, with common splits being 33/67 or 40/60 (Year 2/Year 3).
For a detailed walkthrough with examples, see our guide on how to calculate a weighted average, or use our weighted grade calculator to compute your result automatically.
Worked Example
Suppose a student has these Year 3 modules (Year 3 weighted at 67%):
| Module | Grade | Credits | Weighted |
|---|
| Dissertation | 72% | 40 | 2,880 |
| Advanced Theory | 65% | 20 | 1,300 |
| Research Methods | 68% | 20 | 1,360 |
| Specialist Option A | 71% | 20 | 1,420 |
| Specialist Option B | 63% | 20 | 1,260 |
Year 3 average = (2,880 + 1,300 + 1,360 + 1,420 + 1,260) ÷ 120 = 68.5%
If Year 2 average was 62%, the overall degree average would be: (62 × 0.33) + (68.5 × 0.67) = 20.46 + 45.90 = 66.36%, which is an Upper Second Class (2:1).
What Employers Think About Each Classification
Employer attitudes towards degree classifications vary by industry, company size, and role type. Here is a realistic breakdown:
| Sector | Typical Minimum | Notes |
|---|
| Investment Banking / Consulting | 2:1 (often First) | Top firms use classification as a screening filter |
| Law (Training Contract) | 2:1 | Magic circle firms may prefer a First |
| Civil Service Fast Stream | 2:2 | Changed from 2:1 in recent years |
| NHS Graduate Scheme | 2:1 | Some roles accept 2:2 with experience |
| Technology / Startups | None / 2:2 | Portfolio and skills valued over grades |
| Creative Industries | None | Portfolio-driven hiring |
| Teaching (PGCE) | 2:2 or equivalent | Subject knowledge tests also required |
| SMEs | Varies | Often no formal minimum |
A growing number of large employers, including PwC, EY, Deloitte, and several technology firms, have removed or softened degree classification requirements in recent years, using aptitude tests and situational judgement assessments instead. This trend recognises that academic grades do not always predict workplace performance.
UK Degree Classification Statistics
HESA's 2022/23 data gives the following national context for classified first-degree qualifiers. It excludes unclassified first degrees.
| Classification | 2022/23 |
|---|
| First | 30% |
| Upper Second (2:1) | 48% |
| Lower Second (2:2) | 20% |
| Third/Pass | 3% |
These figures describe national outcomes, not the classification method for any individual programme. Check your own university regulations for the calculation and borderline rules that apply to you.
International Equivalents
If you need to explain your UK degree classification to an international employer or university, the following approximate equivalences are widely accepted:
| UK Classification | US GPA | German Grade | French Grade | ECTS Grade |
|---|
| First (70%+) | 3.7 - 4.0 | 1.0 - 1.5 | 16 - 20 | A |
| 2:1 (60-69%) | 3.3 - 3.7 | 1.5 - 2.5 | 14 - 16 | B |
| 2:2 (50-59%) | 2.7 - 3.3 | 2.5 - 3.5 | 12 - 14 | C |
| Third (40-49%) | 2.0 - 2.7 | 3.5 - 4.0 | 10 - 12 | D-E |
These are rough guidelines. Different credential evaluation services (such as UK ENIC, WES, or NACES members) may produce slightly different equivalences. If you need a formal comparison, request an official credential evaluation from a recognised agency. You can also use our percentage grade calculator to convert raw marks to percentages before doing any conversion.
For a more precise conversion, our GPA calculator can convert your UK percentage grades to the 4.0 GPA scale.
Borderline Policies
One of the most anxiety-inducing aspects of the classification system is falling close to a boundary. If you average 68% or 69%, you may feel agonisingly close to a First. Many universities recognise this and have borderline policies to handle such cases fairly.
Common borderline approaches include:
- Module profile: If 50% or more of your final-year credits fall in the higher classification band, you may be upgraded. For example, if your average is 68% but 65 of your 120 final-year credits are above 70%, you could be awarded a First.
- Preponderance: The classification is awarded based on which band contains the most credits.
- Dual algorithm: Some universities run two calculations (e.g., with and without the best/worst module) and award the higher result.
- Board discretion: Examination boards may have authority to upgrade borderline candidates based on trajectory, extenuating circumstances, or viva voce examination.
Borderline zones vary by university but typically cover the 2-3 percentage points below each boundary (e.g., 68-69% for the First boundary, 58-59% for the 2:1 boundary). Check your university's regulations to understand their specific policy.
A Brief History of UK Degree Classifications
The classification system originated at the University of Oxford in the early 1800s. Initially, degrees were simply awarded as "Honours" or "Pass," but the system was refined throughout the 19th century to include the familiar First, Second, and Third divisions. The split of Second Class into Upper and Lower (2:1 and 2:2) came later, becoming standard across UK universities by the mid-20th century.
The system has faced periodic calls for reform. In 2009, the Burgess Group recommended replacing classifications with a Higher Education Achievement Record (HEAR), providing a more detailed transcript of a student's achievements. While the HEAR has been adopted alongside classifications, the traditional system persists because of its simplicity and widespread recognition among employers.
Despite its longevity, the classification system has clear limitations. It reduces three or four years of academic work into a single label, ignoring the trajectory of a student's performance, the breadth of their skills, and their co-curricular achievements. The debate about replacing or supplementing it continues in UK higher education policy circles.
The Grade Inflation Debate
National classification data can change over time and should be interpreted with care. The current HESA breakdown is useful context, but it does not establish how an individual course awards marks or classifications.
Universities argue that several legitimate factors contribute to higher grades: better teaching, improved learning technology, more effective student support services, increased use of formative assessment, and changes to module structures that allow students to play to their strengths. Critics counter that institutional rankings and student satisfaction surveys create perverse incentives to award higher grades.
For students, the practical implication is that a First today may carry slightly less distinction than it did twenty years ago. However, it remains the highest classification and is still highly valued by employers and postgraduate programmes.
Postgraduate Classifications
Masters degrees use a different classification system:
Postgraduate certificates and diplomas may use the same boundaries or may simply award a Pass or Fail. Doctoral degrees (PhDs) are not classified; they are either awarded or not, based on a thesis and viva voce examination.
For a detailed calculation of postgraduate grades, use our masters grade calculator.
Tips for Achieving a Higher Classification
If you are aiming to improve your degree classification, these strategies are backed by educational research and the experience of academic advisers:
- Prioritise high-credit modules. A 40-credit dissertation has double the impact of a 20-credit module. Invest your best effort where it counts most.
- Use our grade calculator regularly. Track your progress throughout the year, not just at the end. Knowing your running average helps you set realistic targets for each remaining assessment.
- Study marking criteria. Understanding the difference between a 60% and a 70% answer in your discipline is the fastest way to improve your grades. Request examples of high-scoring work from your department.
- Act on feedback. Previous feedback tells you exactly where you lost marks. Students who systematically address feedback points typically see grade improvements of 5-10 percentage points.
- Choose modules strategically. If you have elective options, consider assessment formats that suit your strengths (coursework vs exams) and topics where you have genuine interest and motivation.
- Engage with academic support. Writing centres, study skills workshops, and personal tutors are underused resources that can help you develop the academic practices associated with higher grades.
- Manage your time across the year. Consistent effort produces better results than last-minute cramming. Plan your semester around assessment deadlines and allocate time proportional to credit values.
Uni Grade Boundaries and Classification Thresholds
Uni grade boundaries are the percentage thresholds used to award UK honours degree classifications. For most undergraduate courses, an overall credit-weighted average of 70% earns a First, 60% earns a 2:1, 50% earns a 2:2, and 40% earns a Third. Your university's regulations determine which years count and how they are weighted, so use the boundaries as a reliable guide rather than a substitute for your official degree results.
| Honours degree classification | Typical boundary | What it means |
|---|
| First Class | 70%+ | Highest of the UK degree classes |
| Upper Second (2:1) | 60% to 69% | Common benchmark for graduate schemes |
| Lower Second (2:2) | 50% to 59% | A strong undergraduate qualification |
| Third Class | 40% to 49% | Honours degree awarded at the pass threshold |
The classification boundaries do not automatically decide every close case. Many universities review students near a boundary, often around 68-69% for a First or 58-59% for a 2:1, and may consider the profile of final-year marks. Check your programme handbook for its exact borderline rule, then use the degree classification calculator to model your own average.
What Is a 2:1 Degree?
A 2:1 degree, formally an Upper Second Class Honours degree, means your final average is normally between 60% and 69%. It is the most common outcome in UK higher education and is frequently listed as the minimum academic requirement for competitive graduate jobs and many taught masters courses. A 2:1 is not a single mark: a student graduating with 61% and one graduating with 69% both receive the same classification, although their module profiles may differ.
First Class Degree Percentage: What Marks Do You Need?
The usual First class degree percentage is 70% or above across the marks that count towards classification. Because credits and year weightings matter, a 70% average does not mean scoring 70% in every module. High marks in larger final-year modules can offset a lower mark elsewhere, while a low mark in a dissertation can carry substantial weight. Track the inputs with our weighted average calculator instead of relying on a simple average.
Key Takeaways
- UK degrees are classified as First (70%+), 2:1 (60-69%), 2:2 (50-59%), Third (40-49%), or Ordinary/Fail (below 40%).
- Classifications are based on a credit-weighted average, usually calculated from Year 2 and Year 3 marks only.
- A 2:1 is the most common classification and the standard employer benchmark, though requirements are evolving.
- Borderline policies vary between universities and can result in upgrades for students near a boundary.
- International equivalences exist but are approximate. Use our GPA calculator for a quick conversion.
- The proportion of Firsts has risen significantly, prompting grade inflation debates.
Degree Classification UK: What to Do With Your Average
When people search for UK degree classification, degree grades, or uni grade boundaries, they usually need a practical next step rather than another definition. First check which modules and years your regulations include. Then calculate the credit-weighted average and compare it with the published classification boundaries. A borderline result may trigger a university-specific review, but an online estimate cannot award an honours degree classification.
Use the degree classification calculator when you have an average to interpret, or the final grade calculator when you need to model remaining marks.